

.png?width=150&height=84&name=logo%20trial%20(23).png)
.png?width=150&height=84&name=logo%20trial%20(24).png)
Unlock your full revenue potential. Understand what truly drives growth and make confident, informed decisions that move your business forward.

Too many pricing decisions still rely on instinct, spreadsheets, or past experience. But in today’s market, that’s not enough. Do you know your true price elasticity? Can you anticipate competitor reactions? And is your analysis fast enough to act when it matters?
Our always-on platform delivers such automated, data-driven pricing insights — right when you need them. For years, we’ve helped businesses optimize pricing strategies. Now, it’s your turn to set the right price with confidence and protect your margins.
“The pricing analyses we have available are the core of our pricing decisions. We don’t rely on gut-feeling anymore and have increased our revenue significantly because of it. This was all very hard and time consuming to do in Excel, but now we have access to these analyses always-on.”
— An FMCG client using ScanmarQED
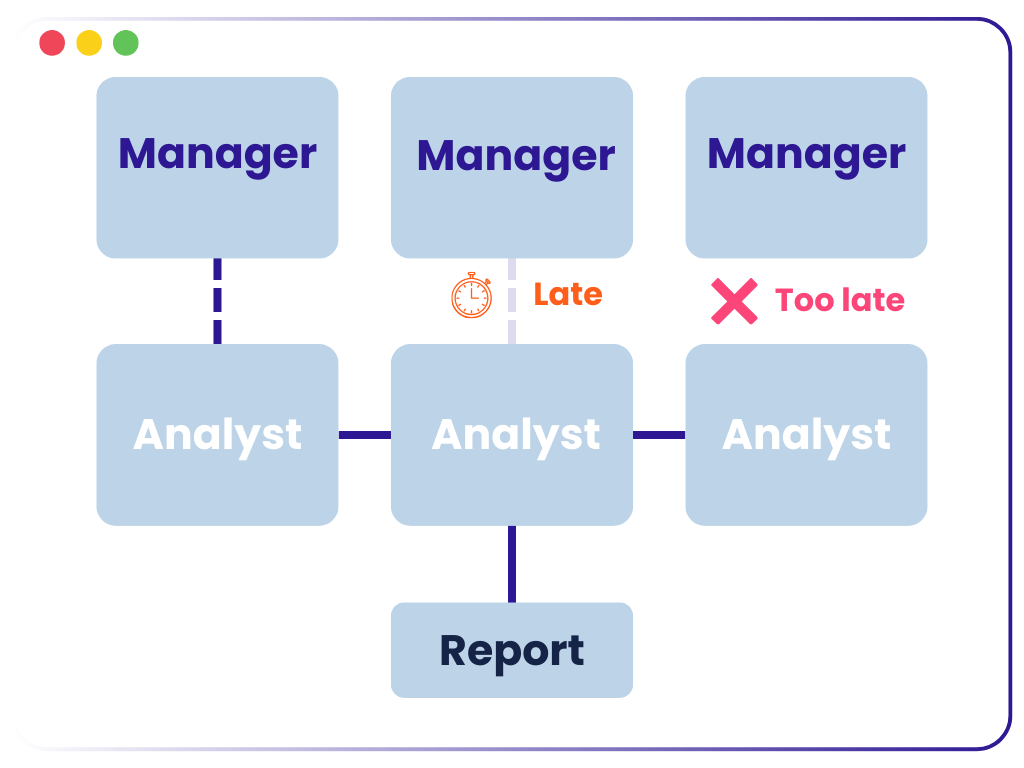
You receive data from suppliers and retailers but by the time your team cleans it, builds Excel charts, and pulls together endless slide decks, the opportunity to act has already passed. And too often, those decks go unread.
Now imagine getting those insights 10x faster — fully automated and ready when you need them. Instead of wrangling data, your team can focus on what really matters: delivering strategic, actionable insights that move the business forward. It’s time to shift from slow and manual to fast and impactful.
“Our company spent 300 hours per quarter on making promotion analyses on sales data. Now that our Insights Team has an automated, state of the art solution for this, our time is now spent on analyses and insights that help drive our growth significantly.”
— An FMCG client using ScanmarQED
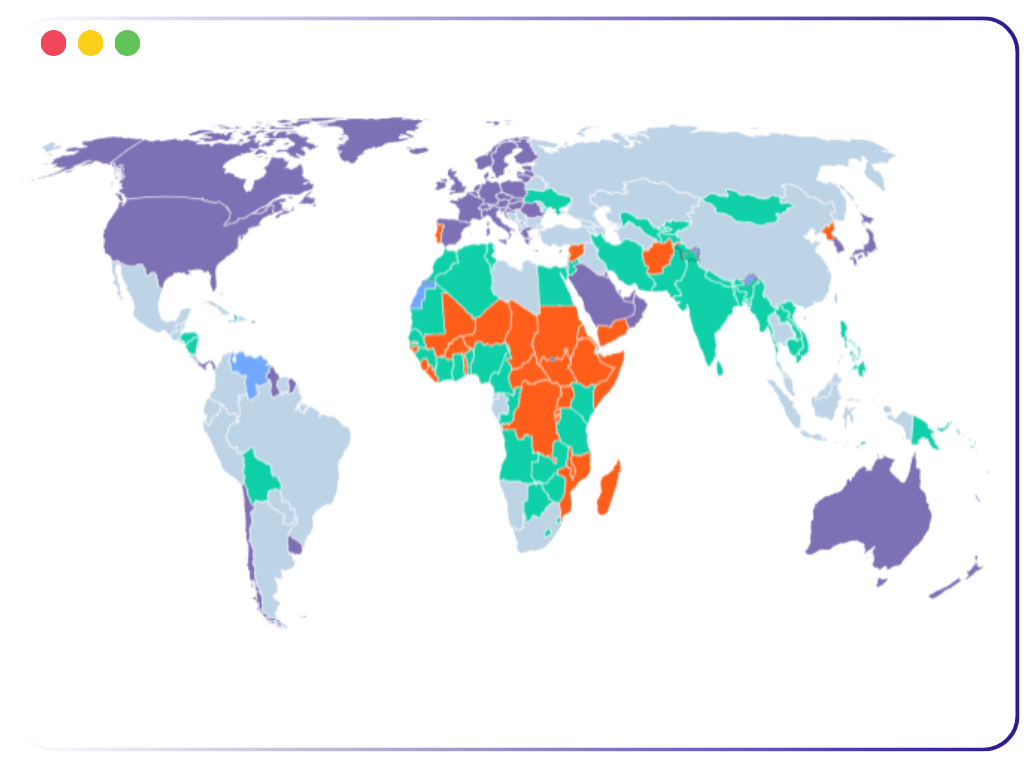
Your retail team blames promotions for lost market share in France. Sales says it’s a product issue. Both have data - but how do you weigh these decisions with confidence while planning expansion into Poland?
With our online insights platform, you can cut through the noise, comparing all factors, identifying the real drivers, and highlighting where your opportunities truly lie. Even better, it quantifies the impact of every action down to the dollar or euro. That’s how data-driven decisions translate into real growth.
“The online platform provides a clear driver analysis and performance across markets and categories. We can even split market change impact from our own brand effort impact on each driver. We know exactly where we need to act.”
— An FMCG client using ScanmarQED
Our platform brings your data together in a single, intuitive dashboard giving you a global HQ overview, tailored regional insights, and detailed deep dives. With clear, actionable information at your fingertips, you can make confident decisions that drive growth across your business.
Uncover the root causes behind revenue and share changes. Compare drivers by their impact to understand the size of each effect on revenue and profit. Spot declines early, take action in time, and turn challenges into opportunities for growth.
.png)
Measure how potential price changes affect your volume and market share, including the impact on competitor products. Use proven models to see whether following a competitor’s move makes sense, with a clear view of the exact effect on your business.
.png)
Identify which products or lines to expand and invest in for stronger revenue growth. Back your retail discussions with data-driven analysis to optimize shelf space. Pinpoint underperforming products that may need to be pruned, so your portfolio works harder for your business.
.png)
E-commerce data often comes from multiple sources, countries, and formats making it hard to manage and even harder to use. Many teams either spend too much time trying to clean it up or give up altogether. Our platform harmonizes and integrates all your e-commerce data, giving you one consistent view that’s ready for reporting and decision-making.
.png)
To understand the true impact of a promotion, you need more than sell-out data; you need to combine it with internal margin data, planning data, and other relevant sources. Our platform brings all your data together, giving you a clear view of promotion effectiveness so you can make confident, results-driven decisions.
.png)
Automate the analysis, enrichment and integration of marketing and market data sources, and easily share Storyboards for better decision making with MarketingTracker.
Learn more
Calculate and visualize promotional effectiveness. Compare promotions, look at promotional KPIs like forward buying, retailer margins, promotional ROI, market share and sales uplift.
Learn more
Identify what is happening in the market and how your brand is doing, quickly and easily. Understand what the specific drivers of good and bad performance are.
Learn more
Contact us today and discover how our solutions can help you make smarter decisions, protect margins, and unlock growth.
What is it? Why is Revenue Optimization crucial?
Revenue optimization is no longer optional - it’s a fundamental component of modern business strategy. By leveraging data, advanced analytics, and strategic pricing and promotional techniques, businesses can unlock significant new revenue streams and boost their bottom line. Whether you're in e-commerce or CPG, mastering revenue optimization means staying ahead of competitors, anticipating market changes, and maximizing every dollar of revenue.
At its core, Revenue Optimization is the practice of using data to enhance market performance. While sales data is the primary data source, it can be enriched with additional sources, such as marketing, finance, and other external datasets.
.png "Visuals for the website (17)")
The best revenue optimization systems continuously analyze data to make adjustments, ensuring companies can respond quickly to market changes while maximizing profitability.
In competitive markets, pricing is a key driver of profitability. If businesses rely on static pricing strategies, they risk overlooking the complex and ever-changing factors that influence consumer behavior, competitive dynamics, and market demand. Pricing and revenue optimization solutions offer businesses a way to use real-time data to fine-tune pricing decisions, taking into account factors like customer segmentation, purchasing behaviors, and competitor activity.
Effective pricing and revenue optimization solutions can:
Implementing a robust pricing and revenue optimization system allows businesses to avoid revenue leakage and capitalize on market opportunities as they arise.
To effectively increase profitability, businesses need more than just good products - they need a structured, data-driven approach to revenue optimization. As consumer preferences shift, competitor strategies evolve, and the pressure to hit revenue targets intensifies, optimizing revenue becomes a complex yet crucial challenge. So, how can businesses turn these variables into opportunities for growth?
Revenue optimization is not just about finding the right price point or running promotions - it’s about using a strategic, data-backed framework to ensure every aspect of your pricing, promotion, and product strategy is aligned to maximize profit. Companies that succeed in this space are leveraging powerful tools like predictive analytics, machine learning, and CPG (Consumer Packaged Goods) data harmonization to drive smarter decisions and fuel growth.
.png)
By analyzing data to uncover patterns and identify gaps, you can optimize various aspects of sales to boost revenue—such as pricing strategy, assortment planning, expansion efforts, new product development, and more.
The process of Revenue Optimization requires a tailored toolset to harmonize and combine data for specific tasks. These tasks that all increase revenue optimization should have the same data foundation to ensure single source of truth and data governance, but specific enough for the task at hand to give all the relevant insights and possible decision inputs into the larger platform and connected systems. For example, your sales forecast is not only relevant for the sales department but should also feed into your ERP and Demand Planning departments.
Predictive analytics help anticipate demand and adjust pricing accordingly.
Ensures the right products are available at the right time. This reduces stockouts and overstock.
Ensures the right promotions are done with the right discounts, at the right retailers and at the right times. This reduces consumer and retailer forward buying and giving unnecessary discounts on your base sales during promotions.
Ensures the right price is placed on each product to maximize revenue, especially during periods of economic flux such as inflation or increased costs due to shipping.
Ensures focus is on the right areas that demand attention, allowing faster decision making and quicker turn-around times to react to market dynamics.
To fully harness revenue optimization, partner with experts. This is where ScanmarQED stands out as a leader in the field. With decades of experience and cutting-edge tools, our team have been pivotal in helping businesses unlock their full revenue potential. We combine data analytics with tailored strategies, giving each client a custom approach that aligns with their unique goals and challenges.
Revenue optimization is not a one-time effort. It is an ongoing process that requires constant monitoring and adjustment. By implementing the correct revenue optimization strategies and leveraging advanced tools, you can significantly enhance your business's revenue potential.
Revenue optimization can help any business, large or small and can lead to lasting profits. Discover how our tools can change your marketing strategy and boost your ROI.
.png)
One of the most significant barriers to effective revenue optimization is the lack of unified data. Many companies have access to vast amounts of data, but it’s often scattered across departments or platforms, making it difficult to extract meaningful insights.
Other common challenges include:
By addressing these challenges, companies can make smarter decisions that drive profitability across all areas of the business.
For ecommerce businesses, where pricing and promotions can change by the hour, revenue optimization is especially critical. In such a fast-moving environment, using manual processes to adjust prices or plan promotions is simply not feasible. Instead, ecommerce companies must rely on automated, data-driven techniques to remain competitive.
Some key revenue optimization techniques for ecommerce include:
These techniques help ecommerce businesses stay agile, ensuring that they maximize revenue without sacrificing customer satisfaction.
In industries like consumer packaged goods (CPG), where vast amounts of data come from various channels and sources, CPG data harmonization is essential for effective revenue optimization. Data harmonization is the process of bringing together disparate data sets into a single, cohesive view that allows for deeper analysis.
When companies unify their CPG data, they can:
Ultimately, CPG data harmonization gives businesses the clarity they need to make more informed, profitable decisions.
While implementing revenue optimization strategies can significantly improve financial performance, it’s not always easy to know where to start. This is where revenue optimization consultants come in. These experts can provide guidance on the best strategies and tools for your specific industry and market conditions, helping you navigate the complexities of revenue management.
Revenue optimization consultants offer:
By working with consultants, businesses can accelerate the implementation of effective revenue optimization strategies and achieve faster results.
CPG Analytics helps improve your revenue strategy by analyzing consumer data to reveal buying patterns, market trends, and product performance. This enables you to optimize pricing, promotions, and inventory management based on real-world insights. By using CPG Analytics, you can make more informed decisions that drive higher sales and better profitability, ensuring you're meeting customer demand efficiently while reducing costs.
Price and promo analytics help you understand the impact of your pricing and promotional strategies on sales and profitability. By analyzing how different price points and promotions affect customer behavior, you can identify which tactics drive the most revenue. This data allows you to fine-tune your pricing and optimize promotions, ensuring that your efforts generate maximum profit without unnecessary discounting.

